Enter the ticker(s) you want to check the rating for:
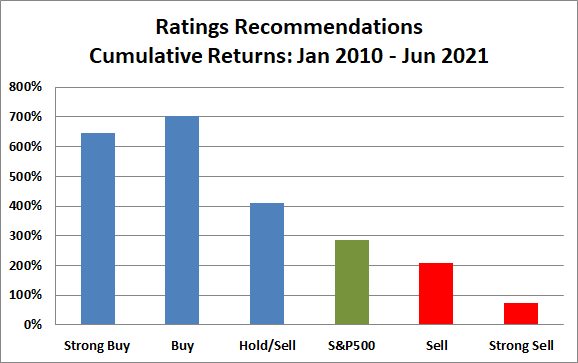
The graph below demonstrates the performance of our Stock Rating System from January 2010 to June 2021. During that period, our Strong Buys recommendations have earned a remarkable 646% while the S&P 500 returns a more modest 285%.

In addition, you can see how stocks that were rated as Strong Sells drastically underperform the broad market. The implication is that our ratings help you identify future winners and help you protect your assets by alerting you about potential losers. Check out our Stock Rating system latest results.
1. Stocks that score high in the Stock Rating System typically outperform shares that score poorly over the next 3 to 12 months.
2. Our Stock Ratings help you weed out troubled companies and to focus mainly on high-quality stocks.
3. Based on Research: The ratings rely on time-tested indicators that have proven to work for the last 30+ years. These include financial criteria, such as profitability, cash flow and earnings estimates. In addition, the ratings are also based on a collection of valuation gauges and price-based indicators. For details about the research process behind the stock Rating System, its methodology, and its track record, read our Rating System's Methodology article.
4. It’s Fast. Subscribers can access ratings on up to 5,500 stocks in just a couple of seconds.
5. Penny Stocks. The Rating System has an extremely strong track record at separating good penny stocks from bad ones. Since 2010, if you invested in penny stocks rated as a strong buy you would have earned a +4055% profit. In contrast, investors who only bought penny stocks that we rated as a strong sell would have earned only +187%. Learn about which penny stocks to watch and buy.
All 5,500 stocks in our database are given one of five possible buy/sell ratings, which you can use to help yourself make investment decisions, see below: