Our Rating System is designed to separate the good stocks from the bad. The objective is to pick stocks that will outperform over the next 3-12 months.
The Rating System uses a factor-based model to grade stocks. The factors are primarily financial variables and ratios (i.e. sales / inventory). However, the Rating System also includes price-based technical criteria. Importantly, each factor in our model has historically had a strong correlation with future stock returns. For example, one of the model inputs is operating cash flow. We have found that stocks with high operating cash flow typically outperform those with low or negative operating cash flow. Below is a sample of several financial variables and ratios that are input into the model:
Each stock in our database (over 7,000 and growing) is evaluated against all the factors in the model. Stocks receive a score based on how well they measure up against each factor. The Rating System’s recommendations depend on the strength of each stock’s overall model score. There are five possible recommendations:
Companies receiving the highest grade are labeled as Strong Buys. Conversely, those with the lowest scores are labeled as Strong Sells.
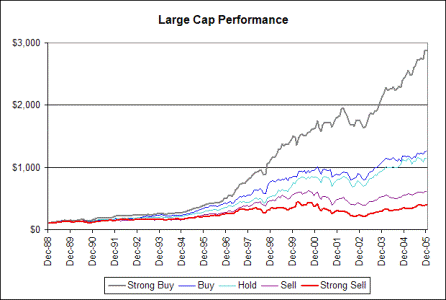
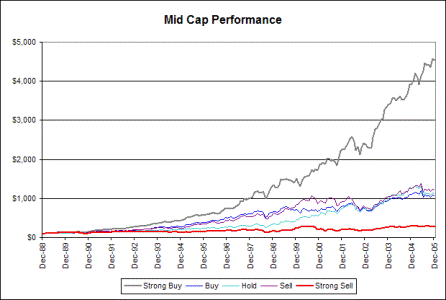
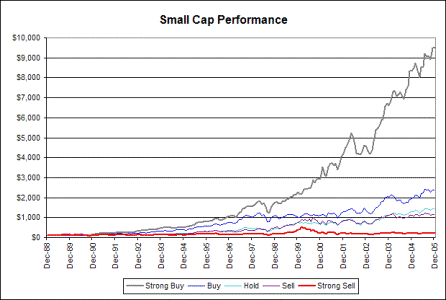
In historical testing between January 1989 and December 2005 for large, mid, and small cap stocks, the Rating System’s recommendations have successfully managed to forecast future leaders and laggards. Moreover, stocks classified as a Strong Buy usually outpaced those graded as a Buy, and shares labeled as a Buy typically beat those designated as a Hold. The three charts below highlight hypothetical portfolio performance based on the five possible recommendations:


The charts clearly demonstrate how holding a basket of stocks rated as a Strong Buy would have been far more rewarding than holding baskets of stocks found in the other four groups. This advantage is even more apparent in mid and small cap portfolios. The charts also show that investors risk drastically underperforming the broad market by buying shares rated as a Sell or Strong Sell.
Investors often assume they must take on more risk to achieve higher than average returns. This is not the case for the Rating System’s Strong Buy recommendations. True, these stocks have massively outperformed the rest of the market (see charts above). However, they have done so with lower risk (i.e. volatility). In portfolio theory, the Sharpe Ratio is used to compare investment returns after accounting for volatility (the higher the ratio, the better). The three tables below show annualized returns along with each portfolio’s Sharpe Ratio. The results indicate that in all three capitalization groups, the Strong Buy portfolio beat the rest of the market on an absolute and risk-adjusted basis. Interestingly, Strong Sell stocks drastically underperformed the rest of the market according to both measures.
| Strong Buy | Buy | Hold | Sell | Strong Sell | |
|---|---|---|---|---|---|
| Large Cap | |||||
| Ann Ror | 21.87% | 16.06% | 15.45% | 11.29% | 8.46% |
| Sharpe | 4.28 | 2.79 | 2.59 | 1.46 | 0.67 |
| Mid Cap | |||||
| Ann Ror | 25.16% | 15.00% | 15.35% | 15.89% | 6.45% |
| Sharpe | 4.39 | 2.01 | 2.00 | 2.04 | 0.24 |
| Small Cap | |||||
| Ann Ror | 30.72% | 20.50% | 17.06% | 15.51% | 4.62% |
| Sharpe | 4.27 | 2.35 | 1.71 | 1.28 | -0.04 |
By using the free Rating System tool, investors can benefit from years of our research.
The universe of publicly-traded stocks in the U.S. is very large. The Rating System recommendations can be used as a starting point to narrow the list of potential investments down to a manageable number (i.e. only consider stocks marked as a Strong Buy). In addition, since the recommendations are refreshed monthly, the tool can help determine when to go in “sell mode.”
We only hold stocks classified as a Strong Buy in our portfolios. However, investors preferring to limit the number of transactions in their accounts (i.e. for tax reasons), may prefer waiting for the Rating System’s recommendation to fall to a Hold or Sell.
Use our Rating System to find the next best stocks.
Check out our market-beating Model Portfolios. All stock picks are made using the Rating System’s recommendations.