The Large Cap portfolio is comprised of mechanically generated, high-quality stocks designed to outperform the S&P 500 on a total return basis while minimizing volatility.
The portfolio is re-balanced monthly and is equally weighted across all major sectors.
A total of 12 stocks are held in the Large Cap portfolio at any given time. Please note that only companies classified as a Strong Buy in our Rating System will be considered for investment.

| Company Name | Ticker | Buy Date | Buy Price | Sell Date | Sell Price | Profit / Loss |
|---|---|---|---|---|---|---|
| Yum! Brands, Inc. | YUM | 2022-05-03 | 115.07 | 2022-07-05 | 117.33 | 1.96% |
| Edwards Lifesciences Corp | EW | 2021-09-09 | 122.08 | 2022-07-05 | 97.97 | -19.75% |
| Barrick Gold Corp (USA) | GOLD | 2022-05-03 | 22.41 | 2022-06-03 | 20.68 | -7.72% |
| Huntsman Corporation | HUN | 2022-03-01 | 38.18 | 2022-05-03 | 34.44 | -9.8% |
| Masco Corp | MAS | 2021-11-01 | 64.64 | 2022-05-03 | 53.89 | -16.63% |
| Cisco Systems, Inc. | CSCO | 2022-01-03 | 63.16 | 2022-03-01 | 54.62 | -13.52% |
| Sherwin-Williams Co | SHW | 2021-12-06 | 341.13 | 2022-03-01 | 255.53 | -25.09% |
| Cognizant Technology Solutions | CTSH | 2021-12-06 | 80.72 | 2022-03-01 | 85.8 | 6.29% |
| Johnson Controls International | JCI | 2021-06-02 | 66.39 | 2022-02-01 | 72.31 | 8.92% |
| Accenture Ltd. | ACN | 2021-10-04 | 319.49 | 2022-01-03 | 407.21 | 27.46% |
| International Paper Company | IP | 2021-07-06 | 60.38 | 2021-12-06 | 47.05 | -22.08% |
| Automatic Data Processing | ADP | 2021-07-06 | 201.11 | 2021-12-06 | 232.2 | 15.46% |
| Flex Ltd | FLEX | 2020-12-01 | 16.71 | 2021-12-06 | 16.97 | 1.56% |
| Zurn Water Solutions Corporation | ZWS | 2021-10-04 | 32.48 | 2021-11-01 | 36.12 | 11.21% |
| LKQ Corporation | LKQ | 2021-06-02 | 50.28 | 2021-11-01 | 55.68 | 10.74% |
| Paychex, Inc. | PAYX | 2021-08-03 | 114.8 | 2021-10-04 | 115.01 | 0.18% |
| UGI Corporation | UGI | 2021-06-02 | 46.38 | 2021-10-04 | 44.24 | -4.61% |
| Cisco Systems, Inc. | CSCO | 2019-12-02 | 44.7 | 2021-10-04 | 54.23 | 21.32% |
| Cerner Corporation | CERN | 2021-03-01 | 70.15 | 2021-09-09 | 75.05 | 6.99% |
| Rollins, Inc. | ROL | 2021-07-06 | 34.95 | 2021-08-03 | 38.99 | 11.56% |
| Linde PLC | LIN | 2021-06-02 | 299.88 | 2021-07-06 | 288.5 | -3.79% |
| Western Union Company, The | WU | 2021-05-03 | 25.66 | 2021-07-06 | 22.96 | -10.52% |
| SPS Commerce, Inc. | SPSC | 2021-04-05 | 101.91 | 2021-07-06 | 102.82 | 0.89% |
| Yeti Holdings Inc | YETI | 2021-05-03 | 87.17 | 2021-06-02 | 87.3 | 0.15% |
| Silgan Holdings Inc. | SLGN | 2021-05-03 | 42.55 | 2021-06-02 | 42.12 | -1.01% |
| Genpact Limited | G | 2020-10-05 | 38.83 | 2021-06-02 | 46.21 | 19.01% |
| Ameren Corp | AEE | 2020-10-05 | 80.72 | 2021-06-02 | 85.22 | 5.57% |
| Franklin Electric Co Inc | FELE | 2021-03-01 | 76.26 | 2021-05-03 | 83.98 | 10.12% |
| Graphic Packaging Holding Comp | GPK | 2021-01-04 | 16.9 | 2021-05-03 | 18.74 | 10.89% |
| Masco Corp | MAS | 2020-09-01 | 59.36 | 2021-05-03 | 65.14 | 9.74% |
| TELUS Corporation (USA) | TU | 2021-03-01 | 20.53 | 2021-04-05 | 20.26 | -1.32% |
| Triton International Ltd | TRTN | 2020-12-01 | 44.65 | 2021-03-01 | 57.25 | 28.22% |
| Iqvia Holdings Inc | IQV | 2020-11-02 | 155.13 | 2021-03-01 | 194.39 | 25.31% |
| Cadence Design Systems | CDNS | 2020-07-06 | 98.74 | 2021-03-01 | 147.44 | 49.32% |
| Sealed Air Corp. | SEE | 2020-11-02 | 40.49 | 2021-01-04 | 45.0 | 11.14% |
| NortonLifeLock Inc | NLOK | 2020-10-05 | 21.52 | 2020-12-01 | 18.23 | -15.29% |
| Broadridge Financial Solutions | BR | 2020-04-03 | 92.39 | 2020-12-01 | 148.45 | 60.68% |
| The Ensign Group, Inc. | ENSG | 2020-10-05 | 57.85 | 2020-11-02 | 60.86 | 5.2% |
| Amcor PLC | AMCR | 2020-09-01 | 11.24 | 2020-11-02 | 10.85 | -3.47% |
| UGI Corporation | UGI | 2020-09-01 | 34.24 | 2020-10-05 | 33.5 | -2.16% |
| Brown & Brown, Inc. | BRO | 2020-09-01 | 46.69 | 2020-10-05 | 45.73 | -2.06% |
| American Homes 4 Rent | AMH | 2020-09-01 | 28.65 | 2020-10-05 | 29.83 | 4.12% |
| Cerner Corporation | CERN | 2020-06-01 | 72.59 | 2020-10-05 | 71.76 | -1.14% |
| Centurylink Inc | CTL | 2019-12-02 | 14.3 | 2020-10-05 | 11.0 | -23.08% |
| BJ's Wholesale Club, Inc. | BJ | 2020-08-03 | 40.19 | 2020-09-01 | 44.56 | 10.87% |
| Atmos Energy Corporation | ATO | 2020-07-06 | 101.24 | 2020-09-01 | 97.43 | -3.76% |
| Vereit Inc | VER | 2020-06-01 | 5.78 | 2020-09-01 | 6.82 | 17.99% |
| Kinross Gold Corporation (USA) | KGC | 2020-06-01 | 6.77 | 2020-09-01 | 8.76 | 29.39% |
| Kimco Realty Corp | KIM | 2019-11-05 | 21.28 | 2020-09-01 | 12.21 | -42.62% |
| Copart, Inc. | CPRT | 2020-06-01 | 89.68 | 2020-08-03 | 93.29 | 4.03% |
| RealPage Inc | RP | 2020-04-03 | 49.97 | 2020-07-06 | 65.11 | 30.3% |
| Mdu Resources Group Inc | MDU | 2020-04-03 | 20.21 | 2020-07-06 | 22.18 | 9.75% |
| Silgan Holdings Inc. | SLGN | 2020-05-04 | 33.82 | 2020-06-01 | 33.19 | -1.86% |
| Medical Properties Trust, Inc. | MPW | 2020-05-04 | 16.54 | 2020-06-01 | 18.69 | 13% |
| Integer Holdings Corp | ITGR | 2020-05-04 | 70.38 | 2020-06-01 | 78.82 | 11.99% |
| Interpublic Group of Companies | IPG | 2019-12-02 | 22.2 | 2020-06-01 | 17.47 | -21.31% |
| Rayonier Inc. | RYN | 2020-04-03 | 22.15 | 2020-05-04 | 23.26 | 5.01% |
| Graphic Packaging Holding Comp | GPK | 2019-12-02 | 16.32 | 2020-05-04 | 12.91 | -20.89% |
| Medtronic, Inc. | MDT | 2019-09-30 | 108.62 | 2020-05-04 | 95.26 | -12.3% |
| Hewlett Packard Enterprise Co | HPE | 2020-03-02 | 12.89 | 2020-04-03 | 9.3 | -27.85% |
| First Horizon National Corp | FHN | 2019-12-02 | 15.94 | 2020-04-03 | 7.18 | -54.96% |
| AES Corporation, The | AES | 2019-12-02 | 18.92 | 2020-04-03 | 12.24 | -35.31% |
| Genpact Limited | G | 2019-11-05 | 39.61 | 2020-04-03 | 26.2 | -33.86% |
| Leidos Holdings Inc | LDOS | 2019-12-02 | 89.85 | 2020-03-02 | 110.06 | 22.49% |
| Gentex Corporation | GNTX | 2019-11-05 | 29.33 | 2019-12-02 | 28.58 | -2.56% |
| Berry Global Group Inc | BERY | 2019-11-05 | 41.62 | 2019-12-02 | 46.67 | 12.13% |
| AT&T Inc. | T | 2019-11-05 | 39.17 | 2019-12-02 | 37.32 | -4.72% |
| Diodes Incorporated | DIOD | 2019-11-05 | 46.55 | 2019-12-02 | 46.31 | -0.52% |
| Consolidated Edison, Inc. | ED | 2019-11-05 | 88.32 | 2019-12-02 | 85.55 | -3.14% |
| CGI Inc | GIB | 2019-09-30 | 79.14 | 2019-12-02 | 83.29 | 5.24% |
| CubeSmart | CUBE | 2019-07-01 | 33.21 | 2019-12-02 | 30.22 | -9% |
| Verizon Communications | VZ | 2019-09-30 | 60.36 | 2019-11-05 | 59.5 | -1.42% |
| Wendy's Co, The | WEN | 2019-09-03 | 21.82 | 2019-11-05 | 20.84 | -4.49% |
| Omega Healthcare Investors Inc | OHI | 2019-09-03 | 41.24 | 2019-11-05 | 42.39 | 2.79% |
| Valvoline Inc | VVV | 2019-08-05 | 21.74 | 2019-11-05 | 21.99 | 1.15% |
| CMS Energy Corporation | CMS | 2019-07-01 | 57.66 | 2019-11-05 | 60.73 | 5.32% |
| Mantech International Corp | MANT | 2019-06-03 | 60.91 | 2019-11-05 | 75.77 | 24.4% |
| Paychex, Inc. | PAYX | 2019-06-03 | 84.43 | 2019-11-05 | 82.59 | -2.18% |
| Open Text Corp (USA) | OTEX | 2019-09-03 | 39.54 | 2019-09-30 | 40.81 | 3.21% |
| BCE Inc. (USA) | BCE | 2019-08-05 | 45.98 | 2019-09-30 | 48.41 | 5.28% |
| Steris Corporation | STE | 2019-03-01 | 122.6 | 2019-09-30 | 144.49 | 17.85% |
| Sabre Corp | SABR | 2019-08-05 | 24.73 | 2019-09-03 | 23.31 | -5.74% |
| American Homes 4 Rent | AMH | 2019-07-01 | 24.42 | 2019-09-03 | 25.69 | 5.2% |
| Barrick Gold Corp (USA) | GOLD | 2019-07-01 | 14.99 | 2019-08-05 | 17.59 | 17.34% |
| Cadence Design Systems | CDNS | 2019-06-03 | 61.7 | 2019-08-05 | 67.5 | 9.4% |
| TransCanada Corporation (USA) | TRP | 2019-05-01 | 47.44 | 2019-08-05 | 47.83 | 0.82% |
| Service Corporation Internatio | SCI | 2018-11-05 | 43.0 | 2019-08-05 | 44.81 | 4.21% |
| Wheaton Precious Metals Corp | WPM | 2019-06-03 | 22.61 | 2019-07-01 | 23.35 | 3.27% |
| WP Carey Inc | WPC | 2019-06-03 | 83.51 | 2019-07-01 | 80.33 | -3.81% |
| Alliant Energy Corporation | LNT | 2019-06-03 | 48.0 | 2019-07-01 | 48.99 | 2.06% |
| Northwest Bancorp, Inc. | NWBI | 2019-06-03 | 16.91 | 2019-07-01 | 17.61 | 4.14% |
| Sensient Technologies Corporat | SXT | 2019-05-01 | 70.5 | 2019-06-03 | 68.08 | -3.43% |
| Genpact Limited | G | 2019-04-01 | 35.41 | 2019-06-03 | 35.98 | 1.61% |
| American States Water Company | AWR | 2019-04-01 | 70.34 | 2019-06-03 | 73.47 | 4.45% |
| Nuance Communications Inc. | NUAN | 2019-04-01 | 17.12 | 2019-06-03 | 16.7 | -2.45% |
| Starwood Property Trust, Inc. | STWD | 2019-02-04 | 22.16 | 2019-06-03 | 22.41 | 1.13% |
| Corning Incorporated | GLW | 2018-12-03 | 33.39 | 2019-06-03 | 28.85 | -13.6% |
| Gildan Activewear Inc (USA) | GIL | 2018-09-04 | 28.99 | 2019-06-03 | 35.81 | 23.53% |
| Kinder Morgan Inc | KMI | 2019-02-04 | 18.36 | 2019-05-01 | 19.59 | 6.7% |
| PolyOne Corporation | POL | 2018-11-05 | 33.62 | 2019-05-01 | 26.83 | -20.2% |
| CenterPoint Energy, Inc. | CNP | 2018-08-01 | 27.93 | 2019-04-01 | 30.7 | 9.92% |
| Pentair, Inc. | PNR | 2018-08-01 | 43.2 | 2019-04-01 | 45.49 | 5.3% |
| FLIR Systems, Inc. | FLIR | 2018-06-04 | 55.32 | 2019-04-01 | 48.76 | -11.86% |
| Boston Scientific Corporation | BSX | 2018-12-03 | 38.51 | 2019-03-01 | 40.75 | 5.82% |
| Realty Income Corp | O | 2018-12-03 | 64.45 | 2019-02-04 | 68.83 | 6.8% |
| Cameco Corp (USA) | CCJ | 2018-11-05 | 12.1 | 2019-02-04 | 12.78 | 5.62% |
| Life Storage Inc | LSI | 2018-09-04 | 96.4 | 2018-12-03 | 97.95 | 1.61% |
| Hologic, Inc. | HOLX | 2018-09-04 | 39.72 | 2018-12-03 | 44.89 | 13.02% |
| Cadence Design Systems | CDNS | 2017-06-01 | 34.98 | 2018-12-03 | 46.22 | 32.13% |
| McDermott International | MDR | 2018-10-01 | 17.87 | 2018-11-05 | 9.79 | -45.22% |
| Fulton Financial Corp | FULT | 2018-07-02 | 16.55 | 2018-11-05 | 16.25 | -1.81% |
| Mondelez International Inc | MDLZ | 2018-04-02 | 40.71 | 2018-11-05 | 42.71 | 4.91% |
| Enbridge Energy Partners, L.P. | EEP | 2018-09-04 | 11.48 | 2018-10-01 | 11.24 | -2.09% |
| CubeSmart | CUBE | 2018-06-04 | 31.42 | 2018-09-04 | 30.19 | -3.91% |
| Columbia Sportswear Company | COLM | 2018-06-04 | 89.42 | 2018-09-04 | 91.0 | 1.77% |
| Zoetis Inc | ZTS | 2018-05-01 | 83.4 | 2018-09-04 | 89.97 | 7.88% |
| Plains All American Pipeline, | PAA | 2018-05-01 | 23.58 | 2018-09-04 | 26.1 | 10.69% |
| Cameco Corp (USA) | CCJ | 2018-06-04 | 10.96 | 2018-08-01 | 10.87 | -0.82% |
| Enterprise Products Partners L | EPD | 2018-03-05 | 25.1 | 2018-08-01 | 29.41 | 17.17% |
| CNO Financial Group Inc | CNO | 2017-10-04 | 23.72 | 2018-07-02 | 19.09 | -19.52% |
| Silgan Holdings Inc. | SLGN | 2018-05-01 | 27.99 | 2018-06-04 | 27.61 | -1.36% |
| IDEX Corporation | IEX | 2018-05-01 | 133.34 | 2018-06-04 | 139.24 | 4.42% |
| XPO Logistics Inc | XPO | 2018-03-05 | 100.89 | 2018-06-04 | 107.41 | 6.46% |
| Gildan Activewear Inc (USA) | GIL | 2017-09-05 | 31.08 | 2018-06-04 | 29.42 | -5.34% |
| Cenovus Energy Inc (USA) | CVE | 2018-03-05 | 7.89 | 2018-05-01 | 10.06 | 27.5% |
| Masco Corp | MAS | 2017-12-04 | 43.3 | 2018-05-01 | 38.5 | -11.09% |
| Graphic Packaging Holding Comp | GPK | 2017-11-01 | 15.83 | 2018-05-01 | 14.09 | -10.99% |
| Baxter International Inc. | BAX | 2017-09-05 | 62.18 | 2018-05-01 | 70.15 | 12.82% |
| Altria Group, Inc. | MO | 2017-12-04 | 70.08 | 2018-04-02 | 60.51 | -13.66% |
| Cosan Ltd (USA) | CZZ | 2017-12-04 | 9.4 | 2018-03-05 | 11.5 | 22.34% |
| SkyWest, Inc. | SKYW | 2017-11-01 | 47.05 | 2018-03-05 | 55.45 | 17.85% |
| IDACORP Inc | IDA | 2017-07-03 | 84.91 | 2018-03-05 | 82.78 | -2.51% |
| Occidental Petroleum Corporati | OXY | 2017-11-01 | 65.46 | 2017-12-04 | 70.06 | 7.03% |
| Flowers Foods, Inc. | FLO | 2017-10-04 | 18.83 | 2017-12-04 | 20.11 | 6.8% |
| Toro Company, The | TTC | 2017-06-01 | 69.03 | 2017-12-04 | 66.25 | -4.03% |
| Avery Dennison Corp | AVY | 2017-09-05 | 94.8 | 2017-11-01 | 107.03 | 12.9% |
| TransCanada Corporation (USA) | TRP | 2017-09-05 | 50.37 | 2017-11-01 | 47.98 | -4.74% |
| Canadian National Railway (USA | CNI | 2017-03-03 | 71.7 | 2017-11-01 | 80.02 | 11.6% |
| Brown & Brown, Inc. | BRO | 2017-09-05 | 45.48 | 2017-10-04 | 48.76 | 7.21% |
| PepsiCo, Inc. | PEP | 2017-08-01 | 115.92 | 2017-10-04 | 109.34 | -5.68% |
| Green Dot Corporation | GDOT | 2017-08-01 | 40.22 | 2017-09-05 | 48.13 | 19.67% |
| Marathon Oil Corporation | MRO | 2017-08-01 | 11.91 | 2017-09-05 | 11.29 | -5.21% |
| Becton, Dickinson and Co. | BDX | 2017-08-01 | 201.2 | 2017-09-05 | 200.07 | -0.56% |
| Dorman Products Inc. | DORM | 2017-03-03 | 81.73 | 2017-09-05 | 67.09 | -17.91% |
| Dow Chemical Co | DOW | 2017-08-01 | 64.69 | 2017-08-31 | 66.65 | 3.03% |
| Barnes Group Inc. | B | 2017-07-03 | 59.01 | 2017-08-01 | 59.96 | 1.61% |
| World Fuel Services Corporatio | INT | 2017-06-01 | 35.85 | 2017-08-01 | 33.37 | -6.92% |
| Chemed Corporation | CHE | 2017-05-01 | 203.74 | 2017-08-01 | 197.84 | -2.9% |
| Altria Group, Inc. | MO | 2017-02-01 | 70.82 | 2017-08-01 | 65.5 | -7.51% |
| BGC Partners, Inc. | BGCP | 2017-02-01 | 10.96 | 2017-08-01 | 12.61 | 15.05% |
| Kronos Worldwide, Inc. | KRO | 2017-06-01 | 17.92 | 2017-07-03 | 18.34 | 2.34% |
| OGE Energy Corp. | OGE | 2017-01-03 | 32.92 | 2017-07-03 | 34.83 | 5.8% |
| Lincoln Electric Holdings, Inc | LECO | 2017-05-01 | 89.73 | 2017-06-01 | 91.78 | 2.28% |
| Tallgrass Energy GP LP | TEGP | 2017-05-01 | 27.8 | 2017-06-01 | 25.79 | -7.23% |
| AMETEK, Inc. | AME | 2017-03-03 | 54.76 | 2017-06-01 | 61.51 | 12.33% |
| Curtiss-Wright Corp. | CW | 2016-06-01 | 83.74 | 2017-06-01 | 90.61 | 8.2% |
| Holly Energy Partners, L.P. | HEP | 2017-02-01 | 35.91 | 2017-05-01 | 37.35 | 4.01% |
| Ingersoll-Rand Company Limited | IR | 2017-02-01 | 77.61 | 2017-05-01 | 88.78 | 14.39% |
| IDEXX Laboratories, Inc. | IDXX | 2016-12-01 | 114.17 | 2017-05-01 | 163.73 | 43.41% |
| Textron Inc. | TXT | 2016-11-01 | 39.53 | 2017-05-01 | 46.13 | 16.7% |
| Donaldson Company, Inc. | DCI | 2017-02-01 | 41.83 | 2017-03-03 | 45.19 | 8.03% |
| Iron Mountain Inc | IRM | 2017-02-01 | 35.98 | 2017-03-03 | 36.36 | 1.06% |
| Vishay Intertechnology | VSH | 2017-01-03 | 16.25 | 2017-03-03 | 16.35 | 0.62% |
| Hawaiian Holdings, Inc. | HA | 2017-01-03 | 56.15 | 2017-02-01 | 50.5 | -10.06% |
| LCI Industries | LCII | 2017-01-03 | 116.5 | 2017-02-01 | 108.35 | -7% |
| CVR Energy, Inc. | CVI | 2017-01-03 | 24.84 | 2017-02-01 | 21.83 | -12.12% |
| Washington Federal Inc. | WAFD | 2016-12-01 | 32.36 | 2017-02-01 | 32.7 | 1.05% |
| Hillenbrand, Inc. | HI | 2016-08-01 | 31.85 | 2017-02-01 | 37.05 | 16.33% |
| Colgate-Palmolive Company | CL | 2016-08-01 | 74.27 | 2017-02-01 | 64.72 | -12.86% |
| Royal Caribbean Cruises Ltd | RCL | 2016-12-01 | 78.85 | 2017-01-03 | 83.87 | 6.37% |
| CONSOL Energy Inc. | CNX | 2016-12-01 | 20.2 | 2017-01-03 | 17.41 | -13.81% |
| NextEra Energy Inc | NEE | 2016-11-01 | 125.89 | 2017-01-03 | 118.72 | -5.7% |
| A. O. Smith Corp | AOS | 2016-11-01 | 44.72 | 2017-01-03 | 47.5 | 6.22% |
| CLARCOR Inc. | CLC | 2016-04-04 | 56.42 | 2017-01-03 | 82.39 | 46.03% |
| NuStar Energy L.P. | NS | 2016-11-01 | 46.82 | 2016-12-01 | 47.55 | 1.56% |
| Hawaiian Holdings, Inc. | HA | 2016-11-01 | 45.2 | 2016-12-01 | 50.4 | 11.5% |
| Prospect Energy Corporation | PSEC | 2016-08-01 | 7.93 | 2016-12-01 | 7.92 | -0.13% |
| Quest Diagnostics Incorporated | DGX | 2016-06-01 | 76.53 | 2016-12-01 | 87.45 | 14.27% |
| Marathon Petroleum Corp | MPC | 2016-10-03 | 40.96 | 2016-11-01 | 42.34 | 3.37% |
| Convergys Corp | CVG | 2016-10-03 | 30.09 | 2016-11-01 | 28.23 | -6.18% |
| SunCoke Energy Inc | SXC | 2016-09-01 | 6.46 | 2016-11-01 | 10.18 | 57.59% |
| CMS Energy Corporation | CMS | 2016-07-05 | 45.76 | 2016-11-01 | 41.53 | -9.24% |
| Southwest Airlines Co. | LUV | 2016-05-02 | 43.79 | 2016-11-01 | 39.68 | -9.39% |
| Veeva Systems Inc | VEEV | 2016-09-01 | 40.23 | 2016-10-03 | 41.22 | 2.46% |
| Questar Corporation | STR | 2016-07-05 | 25.21 | 2016-10-03 | 25.06 | -0.6% |
| Textron Inc. | TXT | 2016-08-01 | 38.67 | 2016-09-01 | 40.81 | 5.53% |
| Cadence Design Systems | CDNS | 2016-06-01 | 24.74 | 2016-09-01 | 25.51 | 3.11% |
| Bloomin' Brands Inc | BLMN | 2016-06-01 | 19.25 | 2016-08-01 | 17.96 | -6.7% |
| Illinois Tool Works Inc. | ITW | 2016-06-01 | 106.11 | 2016-08-01 | 115.44 | 8.79% |
| Altria Group, Inc. | MO | 2016-06-01 | 63.8 | 2016-08-01 | 67.65 | 6.03% |
| Great Western Bancorp Inc | GWB | 2016-06-01 | 34.16 | 2016-08-01 | 32.74 | -4.16% |
| Republic Services, Inc. | RSG | 2015-12-01 | 43.48 | 2016-08-01 | 51.21 | 17.78% |
| PPL Corp | PPL | 2016-06-01 | 38.27 | 2016-07-05 | 37.62 | -1.7% |
| Magellan Midstream Partners, L | MMP | 2016-04-04 | 64.37 | 2016-07-05 | 75.21 | 16.84% |
| HB Fuller Co | FUL | 2016-05-02 | 45.01 | 2016-06-01 | 46.06 | 2.33% |
| Leggett & Platt, Inc. | LEG | 2016-05-02 | 49.83 | 2016-06-01 | 50.63 | 1.61% |
| Chimera Investment Corporation | CIM | 2016-05-02 | 14.05 | 2016-06-01 | 15.15 | 7.83% |
| Gigamon Inc | GIMO | 2016-05-02 | 31.7 | 2016-06-01 | 31.78 | 0.25% |
| Consolidated Edison, Inc. | ED | 2016-04-04 | 76.18 | 2016-06-01 | 73.65 | -3.32% |
| Newell Rubbermaid Inc. | NWL | 2016-04-04 | 45.18 | 2016-06-01 | 47.93 | 6.09% |
| Bruker Corporation | BRKR | 2016-01-04 | 23.63 | 2016-06-01 | 26.29 | 11.26% |
| DENTSPLY International Inc. | XRAY | 2015-11-02 | 62.18 | 2016-06-01 | 62.48 | 0.48% |
| Under Armour Inc | UA | 2016-04-04 | 43.03 | 2016-05-02 | 43.74 | 1.65% |
| Huntington Bancshares Incorporated | HBAN | 2016-04-04 | 9.51 | 2016-05-02 | 10.19 | 7.15% |
| Public Storage | PSA | 2016-04-04 | 276.27 | 2016-05-02 | 252.57 | -8.58% |
| Sealed Air Corp. | SEE | 2016-03-01 | 46.23 | 2016-05-02 | 48.65 | 5.23% |
| Textron Inc. | TXT | 2015-09-01 | 37.11 | 2016-05-02 | 39.01 | 5.12% |
| Orbital ATK Inc | OA | 2016-03-01 | 77.62 | 2016-04-04 | 86.58 | 11.54% |
| NextEra Energy Inc | NEE | 2016-03-01 | 112.6 | 2016-04-04 | 118.72 | 5.44% |
| C.H. Robinson Worldwide, Inc. | CHRW | 2016-03-01 | 70.31 | 2016-04-04 | 73.47 | 4.49% |
| Investors Bancorp, Inc. | ISBC | 2016-03-01 | 11.61 | 2016-04-04 | 11.56 | -0.43% |
| Cameron International Corporat | CAM | 2016-03-01 | 67.15 | 2016-04-04 | 66.01 | -1.7% |
| Pool Corporation | POOL | 2016-02-01 | 83.69 | 2016-04-04 | 87.43 | 4.47% |
| Coca-Cola Company, The | KO | 2014-10-01 | 40.76 | 2016-04-04 | 46.89 | 15.04% |
| Eversource Energy | ES | 2016-02-01 | 54.13 | 2016-03-01 | 54.23 | 0.18% |
| Matson Inc | MATX | 2015-12-01 | 52.21 | 2016-03-01 | 39.71 | -23.94% |
| Xylem Inc | XYL | 2015-12-01 | 37.48 | 2016-03-01 | 37.94 | 1.23% |
| World Fuel Services Corporatio | INT | 2015-10-01 | 35.91 | 2016-03-01 | 47.5 | 32.28% |
| BGC Partners, Inc. | BGCP | 2015-09-01 | 8.47 | 2016-03-01 | 8.85 | 4.49% |
| Barnes Group Inc. | B | 2015-09-01 | 36.82 | 2016-03-01 | 34.92 | -5.16% |
| Xcel Energy Inc. | XEL | 2015-12-01 | 35.64 | 2016-02-01 | 38.56 | 8.19% |
| Steelcase Inc. | SCS | 2015-11-02 | 19.51 | 2016-02-01 | 12.73 | -34.75% |
| CAE, Inc. (USA) | CAE | 2015-12-01 | 11.45 | 2016-01-04 | 10.93 | -4.54% |
| Keysight Technologies Inc | KEYS | 2015-11-02 | 33.37 | 2015-12-01 | 29.99 | -10.13% |
| Wisconsin Energy Corp | WEC | 2015-11-02 | 51.23 | 2015-12-01 | 49.91 | -2.58% |
| Expeditors International of Wa | EXPD | 2015-08-03 | 46.74 | 2015-12-01 | 48.91 | 4.64% |
| Ritchie Bros. Auctioneers | RBA | 2015-06-01 | 28.56 | 2015-12-01 | 26.4 | -7.56% |
| Sirius XM Radio Inc. | SIRI | 2015-01-05 | 3.4 | 2015-12-01 | 4.16 | 22.35% |
| Interface, Inc. | TILE | 2015-10-01 | 22.63 | 2015-11-02 | 19.81 | -12.46% |
| Cadence Design Systems | CDNS | 2015-09-01 | 19.72 | 2015-11-02 | 22.26 | 12.88% |
| Abbott Laboratories | ABT | 2015-09-01 | 43.32 | 2015-11-02 | 45.43 | 4.87% |
| CMS Energy Corporation | CMS | 2015-05-04 | 33.77 | 2015-11-02 | 35.95 | 6.46% |
| CVR Energy, Inc. | CVI | 2015-09-01 | 38.46 | 2015-10-01 | 42.12 | 9.52% |
| Leggett & Platt, Inc. | LEG | 2015-09-01 | 42.93 | 2015-10-01 | 41.65 | -2.98% |
| Graphic Packaging Holding Comp | GPK | 2015-08-03 | 14.87 | 2015-09-01 | 13.91 | -6.46% |
| Donaldson Company, Inc. | DCI | 2015-08-03 | 33.29 | 2015-09-01 | 30.81 | -7.45% |
| USANA Health Sciences, Inc. | USNA | 2015-06-01 | 129.52 | 2015-09-01 | 141.49 | 9.24% |
| AmeriGas Partners, L.P. | APU | 2015-06-01 | 47.91 | 2015-09-01 | 43.34 | -9.54% |
| Torchmark Corporation | TMK | 2015-05-04 | 56.67 | 2015-09-01 | 56.67 | 0% |
| Steris Corporation | STE | 2015-03-02 | 64.52 | 2015-09-01 | 62.31 | -3.43% |
| Aspen Technology, Inc. | AZPN | 2014-06-02 | 43.41 | 2015-09-01 | 37.23 | -14.24% |
| Steelcase Inc. | SCS | 2015-07-01 | 18.82 | 2015-08-03 | 17.8 | -5.42% |
| Heartland Express, Inc. | HTLD | 2015-07-01 | 20.27 | 2015-08-03 | 21.58 | 6.46% |
| Lundin Mining Corporation | LUNMF | 2015-06-01 | 4.49 | 2015-08-03 | 3.51 | -21.83% |
| Nike Inc | NKE | 2015-06-01 | 101.76 | 2015-07-01 | 109.43 | 7.54% |
| Golar LNG Partners LP | GMLP | 2015-05-04 | 29.12 | 2015-07-01 | 24.72 | -15.11% |
| Exelis Inc | XLS | 2015-05-04 | 24.54 | 2015-06-01 | 24.66 | 0.49% |
| Plains GP Holdings LP | PAGP | 2015-05-04 | 29.4 | 2015-06-01 | 27.56 | -6.26% |
| Leggett & Platt, Inc. | LEG | 2015-05-04 | 46.17 | 2015-06-01 | 47.31 | 2.47% |
| Zurn Water Solutions Corporation | ZWS | 2015-05-04 | 26.82 | 2015-06-01 | 25.69 | -4.21% |
| Bloomin' Brands Inc | BLMN | 2015-03-02 | 26.09 | 2015-06-01 | 22.39 | -14.18% |
| IDEX Corporation | IEX | 2015-04-01 | 74.94 | 2015-05-04 | 75.53 | 0.79% |
| TFS Financial Corporation | TFSL | 2015-04-01 | 14.69 | 2015-05-04 | 14.57 | -0.82% |
| Knight Transportation | KNX | 2015-04-01 | 31.96 | 2015-05-04 | 29.63 | -7.29% |
| TECO Energy, Inc. | TE | 2015-03-02 | 19.13 | 2015-05-04 | 19.15 | 0.1% |
| Graphic Packaging Holding Comp | GPK | 2015-03-02 | 15.19 | 2015-05-04 | 14.56 | -4.15% |
| FMC Technologies, Inc. | FTI | 2015-03-02 | 39.63 | 2015-05-04 | 42.84 | 8.1% |
| Pool Corporation | POOL | 2014-12-01 | 58.78 | 2015-05-04 | 65.89 | 12.1% |
| Hilltop Holdings Inc. | HTH | 2015-02-02 | 18.6 | 2015-04-01 | 19.39 | 4.25% |
| Extra Space Storage, Inc. | EXR | 2014-12-01 | 58.19 | 2015-04-01 | 67.34 | 15.72% |
| Moog Inc. | MOG-A | 2014-09-02 | 71.86 | 2015-04-01 | 74.35 | 3.47% |
| Holly Energy Partners, L.P. | HEP | 2015-02-02 | 32.15 | 2015-03-02 | 32.09 | -0.19% |
| PNM Resources, Inc. | PNM | 2015-02-02 | 30.56 | 2015-03-02 | 27.95 | -8.54% |
| Textron Inc. | TXT | 2015-01-05 | 41.36 | 2015-03-02 | 44.44 | 7.45% |
| HealthSouth Corp | HLS | 2014-06-02 | 34.28 | 2015-03-02 | 44.11 | 28.68% |
| Sigma-Aldrich Corporation | SIAL | 2012-05-03 | 68.36 | 2015-03-02 | 138.07 | 101.97% |
| Xcel Energy Inc. | XEL | 2014-12-01 | 33.98 | 2015-02-02 | 37.57 | 10.57% |
| Huntington Bancshares Incorporated | HBAN | 2014-11-03 | 9.8 | 2015-02-02 | 10.27 | 4.8% |
| Alliance Holdings GP, L.P. | AHGP | 2014-10-01 | 66.54 | 2015-02-02 | 56.5 | -15.09% |
| USANA Health Sciences, Inc. | USNA | 2014-12-01 | 104.37 | 2015-01-05 | 101.55 | -2.7% |
| Wendy's Co, The | WEN | 2014-10-01 | 8.06 | 2015-01-05 | 8.97 | 11.29% |
| Wisconsin Energy Corp | WEC | 2014-10-01 | 42.86 | 2014-12-01 | 49.68 | 15.91% |
| Steven Madden, Ltd. | SHOO | 2014-10-01 | 31.79 | 2014-12-01 | 33.0 | 3.81% |
| CSX Corporation | CSX | 2014-09-02 | 30.93 | 2014-12-01 | 35.06 | 13.35% |
| Textron Inc. | TXT | 2014-09-02 | 38.41 | 2014-12-01 | 42.53 | 10.73% |
| Euronet Worldwide, Inc. | EEFT | 2014-08-04 | 50.36 | 2014-11-03 | 54.09 | 7.41% |
| Piedmont Natural Gas Company, | PNY | 2014-09-02 | 36.83 | 2014-10-01 | 33.66 | -8.61% |
| J&J Snack Foods Corp. | JJSF | 2014-09-02 | 95.97 | 2014-10-01 | 92.59 | -3.52% |
| John Wiley & Sons Inc | JW-A | 2014-08-04 | 59.76 | 2014-10-01 | 55.4 | -7.3% |
| Donaldson Company, Inc. | DCI | 2014-07-02 | 41.7 | 2014-10-01 | 40.05 | -3.96% |
| Magellan Midstream Partners, L | MMP | 2014-04-01 | 71.13 | 2014-10-01 | 81.54 | 14.64% |
| FLIR Systems, Inc. | FLIR | 2014-06-02 | 34.72 | 2014-09-02 | 33.75 | -2.79% |
| Tyco International Ltd. | TYC | 2014-06-02 | 43.57 | 2014-09-02 | 44.15 | 1.33% |
| Expeditors International of Wa | EXPD | 2014-06-02 | 45.88 | 2014-09-02 | 41.66 | -9.2% |
| Wisconsin Energy Corp | WEC | 2014-04-01 | 46.17 | 2014-09-02 | 44.7 | -3.18% |
| Hillshire Brands Co | HSH | 2014-08-04 | 62.84 | 2014-08-28 | 63.0 | 0.25% |
| B&G Foods, Inc. | BGS | 2014-07-02 | 32.46 | 2014-08-04 | 28.8 | -11.28% |
| Service Corporation Internatio | SCI | 2014-06-02 | 20.0 | 2014-08-04 | 21.27 | 6.35% |
| Fidelity National Information | FIS | 2014-02-03 | 48.44 | 2014-08-04 | 55.94 | 15.48% |
| Steelcase Inc. | SCS | 2014-06-02 | 16.11 | 2014-07-02 | 15.18 | -5.77% |
| Coty Inc | COTY | 2014-05-01 | 16.04 | 2014-07-02 | 17.8 | 10.97% |
| Leggett & Platt, Inc. | LEG | 2014-05-01 | 32.91 | 2014-06-02 | 34.03 | 3.4% |
| National Instruments Corp | NATI | 2014-05-01 | 27.03 | 2014-06-02 | 28.73 | 6.29% |
| Bloomin' Brands Inc | BLMN | 2014-04-01 | 24.76 | 2014-06-02 | 21.29 | -14.01% |
| Exelis Inc | XLS | 2014-04-01 | 19.0 | 2014-06-02 | 17.42 | -8.32% |
| CSX Corporation | CSX | 2014-03-03 | 27.45 | 2014-06-02 | 29.55 | 7.65% |
| IDEXX Laboratories, Inc. | IDXX | 2014-02-03 | 109.09 | 2014-06-02 | 129.17 | 18.41% |
| Orient-Express Hotels Ltd. | OEH | 2013-10-01 | 13.32 | 2014-06-02 | 13.2 | -0.9% |
| V.F. Corporation | VFC | 2014-04-01 | 62.18 | 2014-05-01 | 61.18 | -1.61% |
| Xerox Corporation | XRX | 2013-09-03 | 9.96 | 2014-05-01 | 12.08 | 21.29% |
| PepsiCo, Inc. | PEP | 2012-10-11 | 66.9 | 2014-05-01 | 85.57 | 27.91% |
| Penn West Petroleum Ltd (USA) | PWE | 2014-03-03 | 7.99 | 2014-04-01 | 8.39 | 5.01% |
| Tyco International Ltd. | TYC | 2014-02-03 | 39.55 | 2014-04-01 | 42.94 | 8.57% |
| CLARCOR Inc. | CLC | 2014-02-03 | 53.08 | 2014-04-01 | 57.6 | 8.52% |
| Steelcase Inc. | SCS | 2013-11-04 | 15.96 | 2014-04-01 | 16.68 | 4.51% |
| AES Corporation, The | AES | 2013-04-01 | 12.35 | 2014-04-01 | 14.31 | 15.87% |
| Mobile Mini, Inc. | MINI | 2014-02-03 | 38.77 | 2014-03-03 | 44.19 | 13.98% |
| Magellan Midstream Partners, L | MMP | 2013-09-03 | 52.77 | 2014-03-03 | 68.15 | 29.15% |
| St. Jude Medical, Inc. | STJ | 2014-01-02 | 61.71 | 2014-02-03 | 59.4 | -3.74% |
| Textron Inc. | TXT | 2013-12-03 | 32.61 | 2014-02-03 | 34.28 | 5.12% |
| Southwest Airlines Co. | LUV | 2013-12-03 | 18.24 | 2014-02-03 | 20.43 | 12.01% |
| Synovus Financial Corp. | SNV | 2013-12-03 | 3.4 | 2014-02-03 | 3.23 | -5% |
| Toro Company, The | TTC | 2013-11-04 | 58.96 | 2014-02-03 | 62.0 | 5.16% |
| IDEXX Laboratories, Inc. | IDXX | 2013-11-04 | 108.83 | 2014-01-02 | 105.03 | -3.49% |
| Old National Bancorp | ONB | 2013-08-05 | 14.52 | 2013-12-03 | 15.05 | 3.65% |
| CSX Corporation | CSX | 2013-08-05 | 25.56 | 2013-12-03 | 27.41 | 7.24% |
| Tyco International Ltd. | TYC | 2013-06-04 | 33.4 | 2013-12-03 | 37.86 | 13.35% |
| Boston Scientific Corporation | BSX | 2013-09-03 | 10.9 | 2013-11-04 | 11.99 | 10% |
| General Electric Company | GE | 2013-07-02 | 22.72 | 2013-11-04 | 26.43 | 16.33% |
| Donaldson Company, Inc. | DCI | 2013-06-04 | 36.87 | 2013-11-04 | 39.79 | 7.92% |
| John Wiley & Sons Inc | JW-A | 2013-07-02 | 40.7 | 2013-10-01 | 48.51 | 19.19% |
| PAREXEL International Corporat | PRXL | 2013-08-05 | 51.09 | 2013-09-03 | 47.15 | -7.71% |
| Aspen Technology, Inc. | AZPN | 2013-08-05 | 32.7 | 2013-09-03 | 33.8 | 3.36% |
| Core Laboratories N.V. | CLB | 2013-08-05 | 152.63 | 2013-09-03 | 151.02 | -1.05% |
| Synovus Financial Corp. | SNV | 2013-06-04 | 2.67 | 2013-08-05 | 3.44 | 28.84% |
| Questar Corporation | STR | 2013-06-04 | 24.24 | 2013-08-05 | 24.61 | 1.53% |
| Manhattan Associates, Inc. | MANH | 2013-05-06 | 72.8 | 2013-08-05 | 88.8 | 21.98% |
| Swift Transportation Co | SWFT | 2013-03-05 | 13.93 | 2013-08-05 | 18.05 | 29.58% |
| Owens & Minor, Inc. | OMI | 2012-06-01 | 27.28 | 2013-08-05 | 35.98 | 31.89% |
| Paychex, Inc. | PAYX | 2013-06-04 | 37.1 | 2013-07-02 | 36.94 | -0.43% |
| Fastenal Company | FAST | 2013-06-04 | 50.92 | 2013-07-02 | 45.82 | -10.02% |
| Bloomin' Brands Inc | BLMN | 2013-05-06 | 22.46 | 2013-06-04 | 23.95 | 6.63% |
| Dorman Products Inc. | DORM | 2013-05-06 | 40.97 | 2013-06-04 | 45.49 | 11.03% |
| Genpact Limited | G | 2013-04-01 | 18.22 | 2013-06-04 | 19.45 | 6.75% |
| Capitol Federal Financial, Inc | CFFN | 2013-03-05 | 11.84 | 2013-06-04 | 11.86 | 0.17% |
| Pengrowth Energy Corp (USA) | PGH | 2013-03-05 | 4.54 | 2013-06-04 | 5.21 | 14.76% |
| Barnes Group Inc. | B | 2012-12-07 | 21.22 | 2013-06-04 | 30.11 | 41.89% |
| Xerox Corporation | XRX | 2013-04-01 | 8.6 | 2013-05-06 | 8.76 | 1.86% |
| Steelcase Inc. | SCS | 2013-03-05 | 15.03 | 2013-05-06 | 12.94 | -13.91% |
| Textron Inc. | TXT | 2012-10-11 | 25.38 | 2013-05-06 | 26.76 | 5.44% |
| NiSource Inc. | NI | 2013-03-05 | 28.32 | 2013-03-28 | 29.17 | 3% |
| Red Hat, Inc. | RHT | 2013-01-09 | 54.44 | 2013-03-28 | 48.32 | -11.24% |
| Service Corporation Internatio | SCI | 2011-07-05 | 11.54 | 2013-03-28 | 16.66 | 44.37% |
| Cenovus Energy Inc (USA) | CVE | 2013-02-01 | 33.79 | 2013-03-05 | 31.25 | -7.52% |
| Matson Inc | MATX | 2012-12-07 | 23.33 | 2013-03-05 | 26.01 | 11.49% |
| Euronet Worldwide, Inc. | EEFT | 2012-12-07 | 22.55 | 2013-03-05 | 24.77 | 9.84% |
| NV Energy, Inc. | NVE | 2012-09-04 | 17.45 | 2013-03-05 | 20.12 | 15.3% |
| Genuine Parts Company | GPC | 2012-05-03 | 64.2 | 2013-03-05 | 72.77 | 13.35% |
| Schlumberger Limited. | SLB | 2012-12-07 | 71.83 | 2013-02-01 | 79.7 | 10.96% |
| Synopsys, Inc. | SNPS | 2012-12-07 | 32.92 | 2013-01-09 | 31.43 | -4.53% |
| Natural Resource Partners LP | NRP | 2012-10-11 | 21.43 | 2012-12-07 | 17.93 | -16.33% |
| Donaldson Company, Inc. | DCI | 2012-09-04 | 35.71 | 2012-12-07 | 33.58 | -5.96% |
| CSX Corporation | CSX | 2012-08-13 | 22.58 | 2012-12-07 | 19.91 | -11.82% |
| Tibco Software Inc. | TIBX | 2011-09-01 | 21.78 | 2012-12-07 | 20.37 | -6.47% |
| Fidelity National Information | FIS | 2011-01-03 | 27.41 | 2012-12-07 | 36.16 | 31.92% |
| Genesis Energy, L.P. | GEL | 2012-09-04 | 32.33 | 2012-10-11 | 33.24 | 2.81% |
| Tyco International Ltd. | TYC | 2012-06-01 | 25.62 | 2012-10-11 | 27.46 | 7.18% |
| General Mills, Inc. | GIS | 2011-10-03 | 36.47 | 2012-10-11 | 39.5 | 8.31% |
| Nordson Corporation | NDSN | 2012-08-13 | 53.79 | 2012-09-04 | 59.71 | 11.01% |
| Avista Corporation | AVA | 2012-08-13 | 26.16 | 2012-09-04 | 25.58 | -2.22% |
| ION Geophysical Corporation | IO | 2012-07-06 | 6.41 | 2012-09-04 | 6.78 | 5.77% |
| Heartland Express, Inc. | HTLD | 2012-07-06 | 14.36 | 2012-08-13 | 13.4 | -6.69% |
| Donaldson Company, Inc. | DCI | 2012-07-06 | 33.12 | 2012-08-13 | 34.2 | 3.26% |
| CMS Energy Corporation | CMS | 2012-05-03 | 22.37 | 2012-08-13 | 23.76 | 6.21% |
| ITT Corporation | ITT | 2012-06-01 | 19.69 | 2012-07-06 | 18.09 | -8.13% |
| UTi Worldwide Inc. | UTIW | 2012-05-03 | 17.32 | 2012-07-06 | 14.97 | -13.57% |
| Bristow Group Inc | BRS | 2012-04-02 | 47.76 | 2012-07-06 | 41.14 | -13.86% |
| Beacon Roofing Supply, Inc. | BECN | 2012-05-03 | 26.37 | 2012-06-01 | 23.49 | -10.92% |
| CNO Financial Group Inc | CNO | 2012-05-03 | 7.19 | 2012-06-01 | 6.4 | -10.99% |
| Textron Inc. | TXT | 2012-03-01 | 27.74 | 2012-06-01 | 22.69 | -18.2% |
| Avista Corporation | AVA | 2012-04-02 | 25.97 | 2012-05-03 | 25.68 | -1.12% |
| Entegris, Inc. | ENTG | 2012-04-02 | 9.47 | 2012-05-03 | 8.71 | -8.03% |
| Herman Miller, Inc. | MLHR | 2012-04-02 | 22.68 | 2012-05-03 | 19.88 | -12.35% |
| Hologic, Inc. | HOLX | 2012-04-02 | 21.78 | 2012-05-03 | 17.58 | -19.28% |
| Silgan Holdings Inc. | SLGN | 2011-11-01 | 36.2 | 2012-05-03 | 43.99 | 21.52% |
| CSX Corporation | CSX | 2011-08-02 | 23.07 | 2012-05-03 | 22.46 | -2.64% |
| PNM Resources, Inc. | PNM | 2012-03-01 | 17.9 | 2012-04-02 | 18.63 | 4.08% |
| World Fuel Services Corporatio | INT | 2012-03-01 | 41.59 | 2012-04-02 | 41.78 | 0.46% |
| CLARCOR Inc. | CLC | 2012-03-01 | 50.52 | 2012-04-02 | 48.93 | -3.15% |
| Becton, Dickinson and Co. | BDX | 2011-10-03 | 69.99 | 2012-04-02 | 77.91 | 11.32% |
| BE Aerospace, Inc. | BEAV | 2011-01-03 | 37.95 | 2012-04-02 | 46.69 | 23.03% |
| Questar Corporation | STR | 2012-02-01 | 19.14 | 2012-03-01 | 19.28 | 0.73% |
| Xcel Energy Inc. | XEL | 2011-12-05 | 25.74 | 2012-03-01 | 26.39 | 2.53% |
| HNI Corporation | HNI | 2011-11-01 | 21.98 | 2012-03-01 | 25.62 | 16.56% |
| Tyco International Ltd. | TYC | 2011-10-03 | 38.83 | 2012-03-01 | 51.81 | 33.43% |
| Alliance Holdings GP, L.P. | AHGP | 2011-11-01 | 47.78 | 2012-02-01 | 53.86 | 12.72% |
| CMS Energy Corporation | CMS | 2011-08-02 | 18.53 | 2011-12-05 | 20.8 | 12.25% |
| Graphic Packaging Holding Comp | GPK | 2011-09-01 | 4.1 | 2011-11-01 | 4.13 | 0.73% |
| Wolverine World Wide, Inc. | WWW | 2011-08-02 | 36.12 | 2011-11-01 | 36.22 | 0.28% |
| Questar Corporation | STR | 2011-07-05 | 17.9 | 2011-11-01 | 18.74 | 4.69% |
| Textron Inc. | TXT | 2011-08-02 | 20.98 | 2011-10-03 | 16.72 | -20.31% |
| Campbell Soup Company | CPB | 2011-08-02 | 32.63 | 2011-10-03 | 32.66 | 0.09% |
| Patterson Companies, Inc. | PDCO | 2011-06-06 | 32.2 | 2011-10-03 | 27.36 | -15.03% |
| Sealed Air Corp. | SEE | 2011-08-02 | 20.37 | 2011-09-01 | 18.23 | -10.51% |
| Activision Blizzard, Inc. | ATVI | 2011-01-03 | 12.33 | 2011-09-01 | 11.57 | -6.16% |
| Tyco International Ltd. | TYC | 2011-05-02 | 48.54 | 2011-08-02 | 42.73 | -11.97% |
| Iconix Brand Group, Inc. | ICON | 2011-05-02 | 23.83 | 2011-08-02 | 21.43 | -10.07% |
| NiSource Inc. | NI | 2011-03-01 | 18.43 | 2011-08-02 | 20.4 | 10.69% |
| Sigma-Aldrich Corporation | SIAL | 2011-02-01 | 64.98 | 2011-08-02 | 63.9 | -1.66% |
| C.H. Robinson Worldwide, Inc. | CHRW | 2011-02-01 | 77.6 | 2011-08-02 | 70.41 | -9.27% |
| Flowers Foods, Inc. | FLO | 2010-10-01 | 16.23 | 2011-08-02 | 21.79 | 34.26% |
| ION Geophysical Corporation | IO | 2011-06-06 | 9.01 | 2011-07-05 | 10.1 | 12.1% |
| Interval Leisure Group, Inc. | IILG | 2011-06-06 | 12.71 | 2011-07-05 | 13.97 | 9.91% |
| McDermott International | MDR | 2011-04-01 | 25.53 | 2011-06-06 | 19.6 | -23.23% |
| R.R. Donnelley & Sons Company | RRD | 2010-09-01 | 15.13 | 2011-06-06 | 20.38 | 34.7% |
| Hologic, Inc. | HOLX | 2010-08-02 | 14.58 | 2011-06-06 | 20.21 | 38.61% |
| Jarden Corporation | JAH | 2011-04-01 | 35.0 | 2011-05-02 | 35.96 | 2.74% |
| Textron Inc. | TXT | 2011-03-01 | 26.23 | 2011-05-02 | 25.91 | -1.22% |
| Questar Corporation | STR | 2011-03-01 | 17.44 | 2011-04-01 | 17.41 | -0.17% |
| Genuine Parts Company | GPC | 2010-12-01 | 47.71 | 2011-04-01 | 54.09 | 13.37% |
| IDEX Corporation | IEX | 2011-02-01 | 40.41 | 2011-03-01 | 40.63 | 0.54% |
| Pinnacle West Capital Corporat | PNW | 2011-01-03 | 40.96 | 2011-03-01 | 42.62 | 4.05% |
| FMC Technologies, Inc. | FTI | 2010-12-01 | 87.15 | 2011-03-01 | 91.86 | 5.4% |
| Solutia Inc. | SOA | 2011-01-03 | 23.41 | 2011-02-01 | 24.58 | 5% |
| J.B. Hunt Transport Services, | JBHT | 2010-12-01 | 37.58 | 2011-02-01 | 41.45 | 10.3% |
| Tyco International Ltd. | TYC | 2010-05-03 | 38.26 | 2011-02-01 | 45.53 | 19% |
| People's United Financial, Inc | PBCT | 2010-12-01 | 12.56 | 2011-01-03 | 14.09 | 12.18% |
| Pentair, Inc. | PNR | 2010-12-01 | 33.51 | 2011-01-03 | 36.98 | 10.36% |
| Aqua America, Inc. | WTR | 2010-12-01 | 21.83 | 2011-01-03 | 22.68 | 3.89% |
| Bemis Company, Inc. | BMS | 2010-11-02 | 31.06 | 2011-01-03 | 32.61 | 4.99% |
| Tibco Software Inc. | TIBX | 2010-10-01 | 17.99 | 2011-01-03 | 19.84 | 10.28% |
| Consolidated Edison, Inc. | ED | 2010-11-02 | 50.12 | 2010-12-01 | 48.75 | -2.73% |
| Woodward Governor Company | WGOV | 2010-11-02 | 32.22 | 2010-12-01 | 35.55 | 10.34% |
| Broadridge Financial Solutions | BR | 2010-11-02 | 22.11 | 2010-12-01 | 21.19 | -4.16% |
| C.H. Robinson Worldwide, Inc. | CHRW | 2010-11-02 | 71.09 | 2010-12-01 | 75.06 | 5.58% |
| UGI Corporation | UGI | 2010-11-02 | 30.3 | 2010-12-01 | 30.38 | 0.26% |
| Warnaco Group, Inc., The | WRC | 2010-09-01 | 44.6 | 2010-12-01 | 54.58 | 22.38% |
| Sealed Air Corp. | SEE | 2010-10-01 | 22.73 | 2010-11-02 | 23.35 | 2.73% |
| IDEX Corporation | IEX | 2010-10-01 | 35.74 | 2010-11-02 | 36.87 | 3.16% |
| Transocean Inc. | RIG | 2010-10-01 | 64.35 | 2010-11-02 | 63.6 | -1.17% |
| J.B. Hunt Transport Services, | JBHT | 2010-09-01 | 34.25 | 2010-11-02 | 36.4 | 6.28% |
| Questar Corporation | STR | 2010-08-02 | 16.58 | 2010-11-02 | 17.4 | 4.95% |
| CMS Energy Corporation | CMS | 2010-06-01 | 14.19 | 2010-11-02 | 18.62 | 31.22% |
| Novell, Inc. | NOVL | 2010-09-01 | 5.76 | 2010-10-01 | 5.98 | 3.82% |
| Crane Co. | CR | 2010-08-02 | 35.94 | 2010-10-01 | 38.57 | 7.32% |
| Pall Corporation | PLL | 2010-08-02 | 38.77 | 2010-10-01 | 41.97 | 8.25% |
| UBS AG (USA) | UBS | 2010-06-01 | 13.0 | 2010-10-01 | 17.12 | 31.69% |
| Conagra Foods, Inc. | CAG | 2010-05-03 | 24.53 | 2010-10-01 | 22.13 | -9.78% |
| MICROS Systems, Inc. | MCRS | 2010-08-02 | 36.79 | 2010-09-01 | 38.47 | 4.57% |
| HCP, Inc. | HCP | 2010-07-01 | 31.72 | 2010-09-01 | 36.47 | 14.97% |
| Fossil, Inc. | FOSL | 2010-07-01 | 35.79 | 2010-09-01 | 48.8 | 36.35% |
| Expeditors International of Wa | EXPD | 2010-06-01 | 37.4 | 2010-09-01 | 40.96 | 9.52% |
| Woodward Governor Company | WGOV | 2010-07-01 | 25.04 | 2010-08-02 | 30.35 | 21.21% |
| Health Management Associates, | HMA | 2010-06-01 | 8.65 | 2010-08-02 | 7.05 | -18.5% |
| UGI Corporation | UGI | 2010-06-01 | 25.14 | 2010-08-02 | 27.15 | 8% |
| Sigma-Aldrich Corporation | SIAL | 2010-05-03 | 60.09 | 2010-08-02 | 57.68 | -4.01% |
| Allscripts-Misys Healthcare So | MDRX | 2010-05-03 | 20.22 | 2010-08-02 | 16.9 | -16.42% |
| Rollins, Inc. | ROL | 2010-06-01 | 20.93 | 2010-07-01 | 20.42 | -2.44% |
| Plum Creek Timber Co. Inc. | PCL | 2010-06-01 | 34.21 | 2010-07-01 | 34.46 | 0.73% |
| Lululemon Athletica inc. | LULU | 2010-05-03 | 41.55 | 2010-07-01 | 37.8 | -9.03% |
| Sirius XM Radio Inc. | SIRI | 2010-05-03 | 1.23 | 2010-06-01 | 1.01 | -17.89% |
| CSX Corporation | CSX | 2010-05-03 | 57.23 | 2010-06-01 | 51.53 | -9.96% |
| McDermott International | MDR | 2010-05-03 | 27.61 | 2010-06-01 | 21.0 | -23.94% |
| NiSource Inc. | NI | 2010-04-01 | 15.93 | 2010-06-01 | 14.56 | -8.6% |
| Erie Indemnity Company | ERIE | 2010-03-01 | 39.24 | 2010-06-01 | 45.13 | 15.01% |
| Hologic, Inc. | HOLX | 2009-11-02 | 14.86 | 2010-06-01 | 14.63 | -1.55% |
| URS Corporation | URS | 2009-05-04 | 45.57 | 2010-06-01 | 43.27 | -5.05% |
| W.R. Grace & Co. | GRA | 2010-04-01 | 28.34 | 2010-05-03 | 29.82 | 5.22% |
| Cameron International Corporat | CAM | 2010-03-01 | 41.52 | 2010-05-03 | 40.77 | -1.81% |
| Automatic Data Processing | ADP | 2010-03-01 | 41.64 | 2010-05-03 | 43.67 | 4.88% |
| SAIC, Inc. | SAI | 2010-03-01 | 19.51 | 2010-05-03 | 17.44 | -10.61% |
| 3M Company | MMM | 2010-02-01 | 79.92 | 2010-05-03 | 89.81 | 12.37% |
| Hershey Company, The | HSY | 2010-01-04 | 35.93 | 2010-05-03 | 47.56 | 32.37% |
| C.H. Robinson Worldwide, Inc. | CHRW | 2009-12-01 | 56.07 | 2010-05-03 | 61.77 | 10.17% |
| Snap-on Incorporated | SNA | 2009-11-02 | 35.54 | 2010-05-03 | 48.76 | 37.2% |
| Titanium Metals Corporation | TIE | 2010-03-01 | 12.28 | 2010-04-01 | 16.87 | 37.38% |
| Duke Energy Corporation | DUK | 2010-02-01 | 16.41 | 2010-04-01 | 16.41 | 0% |
| Jack Henry & Associates, Inc. | JKHY | 2010-02-01 | 22.41 | 2010-03-01 | 23.04 | 2.81% |
| Digital Realty Trust, Inc. | DLR | 2010-02-01 | 48.3 | 2010-03-01 | 52.42 | 8.53% |
| Fidelity National Information | FIS | 2010-01-04 | 23.82 | 2010-03-01 | 23.07 | -3.15% |
| Exxon Mobil Corporation | XOM | 2010-01-04 | 68.7 | 2010-03-01 | 65.4 | -4.8% |
| Sonoco Products Company | SON | 2009-11-02 | 26.43 | 2010-03-01 | 30.0 | 13.51% |
| National Retail Properties, In | NNN | 2010-01-04 | 20.98 | 2010-02-01 | 20.54 | -2.1% |
| Xcel Energy Inc. | XEL | 2010-01-04 | 21.08 | 2010-02-01 | 20.85 | -1.09% |
| Tyco International Ltd. | TYC | 2009-12-01 | 35.46 | 2010-02-01 | 35.54 | 0.23% |
| Tellabs, Inc. | TLAB | 2009-09-01 | 6.13 | 2010-02-01 | 6.47 | 5.55% |
| Oceaneering International | OII | 2009-12-01 | 55.5 | 2010-01-04 | 60.62 | 9.23% |
| Northwest Bancorp, Inc. | NWBI | 2009-12-01 | 10.22 | 2010-01-04 | 11.4 | 11.55% |
| Conagra Foods, Inc. | CAG | 2009-11-02 | 20.89 | 2010-01-04 | 23.11 | 10.63% |
| Equifax Inc. | EFX | 2009-11-02 | 27.6 | 2010-01-04 | 31.47 | 14.02% |
| Duke Energy Corporation | DUK | 2009-11-02 | 15.55 | 2010-01-04 | 16.97 | 9.13% |
| Unit Corporation | UNT | 2009-11-02 | 39.86 | 2009-12-01 | 38.43 | -3.59% |
| CSX Corporation | CSX | 2009-11-02 | 42.64 | 2009-12-01 | 48.82 | 14.49% |
| Brown & Brown, Inc. | BRO | 2009-07-01 | 19.66 | 2009-12-01 | 17.79 | -9.51% |
| Emerson Electric Co. | EMR | 2009-06-01 | 33.26 | 2009-12-01 | 42.19 | 26.85% |
| Union Pacific Corporation | UNP | 2009-10-01 | 58.06 | 2009-11-02 | 55.06 | -5.17% |
| Hershey Company, The | HSY | 2009-10-01 | 39.84 | 2009-11-02 | 37.91 | -4.84% |
| Leggett & Platt, Inc. | LEG | 2009-09-01 | 18.0 | 2009-11-02 | 19.27 | 7.06% |
| Enbridge Inc. (USA) | ENB | 2009-09-01 | 36.91 | 2009-11-02 | 38.82 | 5.17% |
| Boston Scientific Corporation | BSX | 2009-09-01 | 11.25 | 2009-11-02 | 8.21 | -27.02% |
| Waste Connections, Inc. | WCN | 2009-09-01 | 27.18 | 2009-11-02 | 31.35 | 15.34% |
| Aqua America, Inc. | WTR | 2009-09-01 | 16.7 | 2009-11-02 | 15.68 | -6.11% |
| Pactiv Corporation | PTV | 2009-03-03 | 12.0 | 2009-11-02 | 23.1 | 92.5% |
| Continental Airlines, Inc. | CAL | 2009-09-01 | 12.51 | 2009-10-01 | 15.08 | 20.54% |
| Conagra Foods, Inc. | CAG | 2009-06-01 | 18.78 | 2009-10-01 | 21.16 | 12.67% |
| UGI Corporation | UGI | 2009-08-03 | 26.69 | 2009-09-01 | 25.26 | -5.36% |
| Informatica Corporation | INFA | 2009-08-03 | 18.47 | 2009-09-01 | 17.68 | -4.28% |
| National Retail Properties, In | NNN | 2009-08-03 | 20.06 | 2009-09-01 | 19.56 | -2.49% |
| V.F. Corporation | VFC | 2009-08-03 | 65.18 | 2009-09-01 | 68.25 | 4.71% |
| Inergy, L.P. | NRGY | 2009-06-01 | 24.94 | 2009-09-01 | 27.79 | 11.43% |
| Expeditors International of Wa | EXPD | 2009-05-04 | 36.93 | 2009-09-01 | 32.22 | -12.75% |
| Medtronic, Inc. | MDT | 2009-04-01 | 29.4 | 2009-09-01 | 37.85 | 28.74% |
| Federal Realty Inv. Trust | FRT | 2009-06-01 | 53.7 | 2009-08-03 | 57.32 | 6.74% |
| Leggett & Platt, Inc. | LEG | 2009-05-04 | 14.86 | 2009-08-03 | 17.63 | 18.64% |
| CMS Energy Corporation | CMS | 2009-04-01 | 11.83 | 2009-08-03 | 12.84 | 8.54% |
| Pitney Bowes Inc. | PBI | 2009-03-03 | 17.48 | 2009-08-03 | 20.62 | 17.96% |
| Transatlantic Holdings, Inc. | TRH | 2009-06-01 | 40.48 | 2009-07-01 | 43.64 | 7.81% |
| Raytheon Company | RTN | 2009-05-04 | 46.97 | 2009-06-01 | 45.88 | -2.32% |
| Western Union Company, The | WU | 2009-05-04 | 17.64 | 2009-06-01 | 18.13 | 2.78% |
| Realty Income Corp | O | 2009-04-01 | 18.63 | 2009-06-01 | 22.11 | 18.68% |
| Constellation Brands, Inc. | STZ | 2009-04-01 | 11.8 | 2009-06-01 | 12.05 | 2.12% |
| Cameron International Corporat | CAM | 2008-09-02 | 44.38 | 2009-06-01 | 32.45 | -26.88% |
| CSX Corporation | CSX | 2009-04-01 | 26.55 | 2009-05-04 | 32.1 | 20.9% |
| IDEX Corporation | IEX | 2009-04-01 | 22.35 | 2009-05-04 | 25.69 | 14.94% |
| General Electric Company | GE | 2009-03-03 | 7.01 | 2009-05-04 | 13.1 | 86.88% |
| Mattel, Inc. | MAT | 2009-03-03 | 10.72 | 2009-05-04 | 15.46 | 44.22% |
| UnitedHealth Group Inc. | UNH | 2008-11-03 | 23.46 | 2009-05-04 | 23.72 | 1.11% |
| DENTSPLY International Inc. | XRAY | 2009-03-03 | 22.48 | 2009-04-01 | 26.19 | 16.5% |
| Duke Energy Corporation | DUK | 2009-03-03 | 12.22 | 2009-04-01 | 14.26 | 16.69% |
| Expeditors International of Wa | EXPD | 2009-03-03 | 25.26 | 2009-04-01 | 27.86 | 10.29% |
| Express Scripts, Inc. | ESRX | 2009-03-03 | 46.93 | 2009-04-01 | 47.27 | 0.72% |
| McCormick & Company, Incorpora | MKC | 2009-02-02 | 32.1 | 2009-04-01 | 29.67 | -7.57% |
| Honeywell International Inc. | HON | 2008-01-02 | 57.84 | 2009-04-01 | 28.31 | -51.05% |
| ANSYS, Inc. | ANSS | 2009-02-02 | 24.79 | 2009-03-03 | 18.88 | -23.84% |
| Public Service Enterprise Grou | PEG | 2009-02-02 | 31.44 | 2009-03-03 | 25.49 | -18.92% |
| Emerson Electric Co. | EMR | 2009-02-02 | 31.38 | 2009-03-03 | 25.25 | -19.53% |
| Owens & Minor, Inc. | OMI | 2009-02-02 | 39.97 | 2009-03-03 | 31.31 | -21.67% |
| Sonoco Products Company | SON | 2009-02-02 | 22.91 | 2009-03-03 | 17.77 | -22.44% |
| Leggett & Platt, Inc. | LEG | 2008-11-03 | 16.99 | 2009-03-03 | 10.7 | -37.02% |
| Comcast Corporation | CMCSA | 2008-11-03 | 17.03 | 2009-03-03 | 12.5 | -26.6% |
| CSX Corporation | CSX | 2008-10-01 | 52.31 | 2009-03-03 | 22.83 | -56.36% |
| Sealed Air Corp. | SEE | 2009-01-02 | 15.25 | 2009-02-02 | 13.5 | -11.48% |
| Altria Group, Inc. | MO | 2008-12-01 | 14.94 | 2009-02-02 | 16.69 | 11.71% |
| Baxter International Inc. | BAX | 2008-12-01 | 51.23 | 2009-02-02 | 58.65 | 14.48% |
| Exelon Corporation | EXC | 2008-12-01 | 51.27 | 2009-02-02 | 55.3 | 7.86% |
| Raytheon Company | RTN | 2008-11-03 | 49.4 | 2009-02-02 | 48.69 | -1.44% |
| Interactive Data Corp. | IDC | 2008-10-01 | 23.69 | 2009-02-02 | 23.25 | -1.86% |
| Air Products & Chemicals, Inc. | APD | 2008-11-03 | 56.94 | 2009-01-02 | 53.06 | -6.81% |
| Ecolab Inc. | ECL | 2008-11-03 | 37.38 | 2008-12-01 | 34.57 | -7.52% |
| Henry Schein, Inc. | HSIC | 2008-09-02 | 58.92 | 2008-12-01 | 33.3 | -43.48% |
| UGI Corporation | UGI | 2008-09-02 | 27.38 | 2008-12-01 | 22.0 | -19.65% |
| International Flavors & Fragra | IFF | 2008-10-01 | 39.03 | 2008-11-03 | 32.41 | -16.96% |
| Torchmark Corporation | TMK | 2008-10-01 | 58.44 | 2008-11-03 | 42.05 | -28.05% |
| Warnaco Group, Inc., The | WRC | 2008-09-02 | 52.55 | 2008-11-03 | 27.99 | -46.74% |
| Gartner, Inc. | IT | 2008-09-02 | 26.72 | 2008-11-03 | 19.1 | -28.52% |
| Procter & Gamble Company, The | PG | 2008-05-01 | 66.19 | 2008-11-03 | 64.4 | -2.7% |
| 3M Company | MMM | 2008-02-01 | 79.62 | 2008-11-03 | 64.11 | -19.48% |
| Progressive Corporation, The | PGR | 2008-08-01 | 20.2 | 2008-10-01 | 17.38 | -13.96% |
| Microsoft Corporation | MSFT | 2008-06-02 | 27.69 | 2008-10-01 | 26.48 | -4.37% |
| Parker-Hannifin Corporation | PH | 2008-05-01 | 80.73 | 2008-10-01 | 51.09 | -36.71% |
| Expeditors International of Wa | EXPD | 2008-05-01 | 48.23 | 2008-10-01 | 35.8 | -25.77% |
| Cardinal Health, Inc. | CAH | 2008-08-01 | 53.38 | 2008-09-02 | 55.57 | 4.1% |
| V.F. Corporation | VFC | 2008-08-01 | 70.99 | 2008-09-02 | 79.79 | 12.4% |
| Automatic Data Processing | ADP | 2008-07-01 | 42.63 | 2008-09-02 | 45.13 | 5.86% |
| Transocean Inc. | RIG | 2008-06-02 | 148.59 | 2008-09-02 | 124.16 | -16.44% |
| FPL Group, Inc. | FPL | 2008-04-01 | 63.98 | 2008-09-02 | 59.0 | -7.78% |
| C.R. Bard, Inc. | BCR | 2008-06-02 | 90.95 | 2008-08-01 | 92.07 | 1.23% |
| Genuine Parts Company | GPC | 2008-05-01 | 43.35 | 2008-08-01 | 39.94 | -7.87% |
| Torchmark Corporation | TMK | 2008-02-01 | 61.84 | 2008-08-01 | 57.96 | -6.27% |
| Paychex, Inc. | PAYX | 2008-06-02 | 33.79 | 2008-07-01 | 31.75 | -6.04% |
| Cameron International Corporat | CAM | 2008-03-03 | 42.2 | 2008-06-02 | 52.91 | 25.38% |
| Allied Waste Industries, Inc. | AW | 2008-03-03 | 10.5 | 2008-06-02 | 13.35 | 27.14% |
| Henry Schein, Inc. | HSIC | 2008-01-02 | 59.27 | 2008-06-02 | 54.5 | -8.05% |
| Autodesk, Inc. | ADSK | 2007-10-01 | 49.82 | 2008-06-02 | 40.42 | -18.87% |
| Canadian National Railway (USA | CNI | 2008-04-01 | 49.66 | 2008-05-01 | 52.98 | 6.69% |
| Coach, Inc. | COH | 2008-03-03 | 30.76 | 2008-05-01 | 36.04 | 17.17% |
| RPM International Inc. | RPM | 2008-03-03 | 21.0 | 2008-05-01 | 22.58 | 7.52% |
| Pepsi Bottling Group, Inc., Th | PBG | 2007-11-01 | 42.33 | 2008-05-01 | 33.89 | -19.94% |
| Southwest Airlines Co. | LUV | 2008-03-03 | 12.23 | 2008-04-01 | 12.75 | 4.25% |
| Public Service Enterprise Grou | PEG | 2007-12-03 | 48.14 | 2008-04-01 | 41.43 | -13.94% |
| Landstar System, Inc. | LSTR | 2008-02-01 | 46.83 | 2008-03-03 | 47.09 | 0.56% |
| Oceaneering International | OII | 2008-02-01 | 60.36 | 2008-03-03 | 60.76 | 0.66% |
| Covanta Holding Corporation | CVA | 2008-01-02 | 27.46 | 2008-03-03 | 29.11 | 6.01% |
| Rayonier Inc. | RYN | 2007-12-03 | 45.5 | 2008-03-03 | 43.4 | -4.62% |
| Genuine Parts Company | GPC | 2007-06-01 | 49.77 | 2008-03-03 | 41.47 | -16.68% |
| J.B. Hunt Transport Services, | JBHT | 2007-12-03 | 25.87 | 2008-02-01 | 30.9 | 19.44% |
| General Electric Company | GE | 2007-12-03 | 36.62 | 2008-02-01 | 36.16 | -1.26% |
| Principal Financial Group, Inc | PFG | 2007-11-01 | 65.22 | 2008-02-01 | 61.21 | -6.15% |
| Imperial Oil Limited (USA) | IMO | 2007-10-01 | 49.57 | 2008-02-01 | 50.27 | 1.41% |
| Republic Services, Inc. | RSG | 2007-12-03 | 32.75 | 2008-01-02 | 30.64 | -6.44% |
| Caterpillar Inc. | CAT | 2007-12-03 | 72.06 | 2008-01-02 | 70.63 | -1.98% |
| Johnson & Johnson | JNJ | 2007-12-03 | 67.71 | 2008-01-02 | 65.91 | -2.66% |
| Northrop Grumman Corporation | NOC | 2007-11-01 | 81.64 | 2007-12-03 | 81.07 | -0.7% |
| Paychex, Inc. | PAYX | 2007-11-01 | 40.55 | 2007-12-03 | 39.3 | -3.08% |
| TransCanada Corporation (USA) | TRP | 2007-10-01 | 37.01 | 2007-12-03 | 39.48 | 6.67% |
| Ball Corporation | BLL | 2007-10-01 | 54.67 | 2007-12-03 | 45.76 | -16.3% |
| DENTSPLY International Inc. | XRAY | 2007-10-01 | 42.0 | 2007-12-03 | 42.28 | 0.67% |
| Emerson Electric Co. | EMR | 2007-06-01 | 48.27 | 2007-12-03 | 57.43 | 18.98% |
| Expeditors International of Wa | EXPD | 2007-06-01 | 44.51 | 2007-12-03 | 45.97 | 3.28% |
| Ecolab Inc. | ECL | 2007-10-01 | 47.85 | 2007-11-01 | 46.06 | -3.74% |
| Illinois Tool Works Inc. | ITW | 2007-10-01 | 58.47 | 2007-11-01 | 56.6 | -3.2% |
| AFLAC Incorporated | AFL | 2007-10-01 | 58.25 | 2007-11-01 | 62.12 | 6.64% |
| Starbucks Corporation | SBUX | 2007-08-01 | 27.2 | 2007-11-01 | 25.83 | -5.04% |
| Enterprise Products Partners L | EPD | 2007-09-04 | 30.1 | 2007-10-01 | 30.6 | 1.66% |
| Blount International, Inc. | BLT | 2007-09-04 | 13.8 | 2007-10-01 | 12.0 | -13.04% |
| NBT Bancorp Inc. | NBTB | 2007-09-04 | 22.18 | 2007-10-01 | 23.27 | 4.91% |
| Scotts Miracle-Gro Company, Th | SMG | 2007-09-04 | 45.68 | 2007-10-01 | 42.99 | -5.89% |
| Piedmont Natural Gas Company, | PNY | 2007-08-01 | 23.75 | 2007-10-01 | 25.73 | 8.34% |
| Del Monte Foods Company | DLM | 2007-08-01 | 11.77 | 2007-10-01 | 10.57 | -10.2% |
| Compuware Corporation | CPWR | 2007-06-01 | 11.38 | 2007-10-01 | 8.05 | -29.26% |
| Sunrise Senior Living, Inc. | SRZ | 2007-06-01 | 39.61 | 2007-10-01 | 37.46 | -5.43% |
| Dynegy Inc. | DYN | 2007-08-01 | 9.2 | 2007-09-04 | 8.33 | -9.46% |
| Interline Brands, Inc. | IBI | 2007-06-01 | 24.72 | 2007-09-04 | 24.41 | -1.25% |
| USEC Inc. | USU | 2007-06-01 | 22.8 | 2007-09-04 | 13.2 | -42.11% |
| Amtrust Financial Services, In | AFSI | 2007-06-01 | 15.52 | 2007-09-04 | 16.76 | 7.99% |
| McCormick & Company, Incorpora | MKC | 2007-07-02 | 37.84 | 2007-08-01 | 35.65 | -5.79% |
| Stewart Enterprises, Inc. | STEI | 2007-07-02 | 7.76 | 2007-08-01 | 7.0 | -9.79% |
| Buckeye Partners, L.P. | BPL | 2007-06-01 | 51.77 | 2007-08-01 | 52.29 | 1% |
| Aqua America, Inc. | WTR | 2007-06-01 | 22.64 | 2007-08-01 | 21.92 | -3.18% |
| Anthracite Capital Inc. | AHR | 2007-06-01 | 11.93 | 2007-07-02 | 11.94 | 0.08% |
| Darling International Inc. | DAR | 2007-06-01 | 9.2 | 2007-07-02 | 9.49 | 3.15% |
| Ingersoll-Rand Company Limited | IR | 2007-04-02 | 43.7 | 2007-06-01 | 51.5 | 17.85% |
| General Mills, Inc. | GIS | 2007-04-02 | 57.2 | 2007-06-01 | 60.93 | 6.52% |
| General Dynamics Corporation | GD | 2007-04-02 | 75.71 | 2007-06-01 | 79.58 | 5.11% |
| Cameron International Corporat | CAM | 2007-04-02 | 64.21 | 2007-06-01 | 70.65 | 10.03% |
| Boeing Company, The | BA | 2007-04-02 | 88.2 | 2007-06-01 | 99.49 | 12.8% |
| Black & Decker Corporation, Th | BDK | 2007-04-02 | 81.67 | 2007-06-01 | 94.25 | 15.4% |
| Accenture Ltd. | ACN | 2007-04-02 | 38.8 | 2007-06-01 | 41.26 | 6.34% |
| International Business Machine | IBM | 2007-04-02 | 94.51 | 2007-06-01 | 106.16 | 12.33% |
| J.C. Penney Company, Inc. | JCP | 2007-04-02 | 82.58 | 2007-06-01 | 81.76 | -0.99% |
| Koninklijke Philips Electronic | PHG | 2007-04-02 | 38.05 | 2007-06-01 | 42.1 | 10.64% |
| TOTAL S.A. (ADR) | TOT | 2007-04-02 | 69.05 | 2007-06-01 | 76.06 | 10.15% |
| AstraZeneca PLC (ADR) | AZN | 2007-04-02 | 53.15 | 2007-06-01 | 52.71 | -0.83% |
| Time Warner Inc. | TWX | 2007-04-02 | 20.02 | 2007-06-01 | 21.31 | 6.44% |
| Teva Pharmaceutical Industries | TEVA | 2007-04-02 | 37.23 | 2007-06-01 | 39.38 | 5.77% |
| Polo Ralph Lauren Corporation | RL | 2007-04-02 | 89.1 | 2007-06-01 | 96.88 | 8.73% |
| Merck & Co., Inc. | MRK | 2007-04-02 | 44.68 | 2007-06-01 | 51.75 | 15.82% |
| Logitech International SA (USA | LOGI | 2007-04-02 | 27.95 | 2007-06-01 | 26.96 | -3.54% |
| Coca-Cola Femsa SAB de CV | KOF | 2007-01-03 | 37.12 | 2007-06-01 | 40.44 | 8.94% |
| General Electric Company | GE | 2007-01-03 | 37.4 | 2007-06-01 | 37.18 | -0.59% |
| Illinois Tool Works Inc. | ITW | 2007-01-03 | 45.53 | 2007-06-01 | 52.38 | 15.05% |
| Johnson & Johnson | JNJ | 2007-01-03 | 65.59 | 2007-06-01 | 63.41 | -3.32% |
| Quest Diagnostics Incorporated | DGX | 2007-01-03 | 51.19 | 2007-06-01 | 48.91 | -4.45% |
| Raytheon Company | RTN | 2007-01-03 | 51.61 | 2007-06-01 | 55.9 | 8.31% |
| Southern Copper Corporation (U | PCU | 2007-01-03 | 48.12 | 2007-06-01 | 91.86 | 90.9% |
| Honeywell International Inc. | HON | 2007-01-03 | 44.47 | 2007-06-01 | 58.53 | 31.62% |
| Reynolds American, Inc. | RAI | 2006-10-02 | 60.03 | 2007-06-01 | 65.11 | 8.46% |
| Forest Laboratories, Inc. | FRX | 2006-10-02 | 50.68 | 2007-06-01 | 50.22 | -0.91% |
| Colgate-Palmolive Company | ABV | 2006-10-02 | 45.44 | 2007-06-01 | 70.71 | 55.61% |
| Cisco Systems, Inc. | CSCO | 2006-07-03 | 20.0 | 2007-06-01 | 26.86 | 34.3% |
| Waste Management, Inc. | WMI | 2006-07-03 | 34.73 | 2007-06-01 | 39.7 | 14.31% |
| Rohm & Haas Co. | ROH | 2007-03-19 | 50.5 | 2007-04-02 | 51.05 | 1.09% |
| Coca-Cola Enterprises Inc. | CCE | 2007-01-03 | 20.38 | 2007-04-02 | 20.24 | -0.69% |
| Chunghwa Telecom Co., Ltd. (AD | CHT | 2007-01-03 | 19.01 | 2007-04-02 | 18.98 | -0.16% |
| CBS Corporation | CBS | 2007-01-03 | 31.16 | 2007-04-02 | 30.58 | -1.86% |
| American Standard Companies In | ASD | 2007-01-03 | 32.01 | 2007-04-02 | 37.2 | 16.21% |
| Diageo plc (ADR) | DEO | 2007-01-03 | 78.52 | 2007-04-02 | 81.61 | 3.94% |
| Dover Corporation | DOV | 2007-01-03 | 48.43 | 2007-04-02 | 48.42 | -0.02% |
| Freeport-McMoRan Copper & Gold | FCX | 2007-01-03 | 49.8 | 2007-04-02 | 66.2 | 32.93% |
| PT Telekomunikasi Indonesia (A | TLK | 2007-01-03 | 45.92 | 2007-04-02 | 43.04 | -6.27% |
| Office Depot, Inc. | ODP | 2007-01-03 | 38.09 | 2007-04-02 | 35.29 | -7.35% |
| Norsk Hydro ASA (ADR) | NHY | 2007-01-03 | 28.89 | 2007-04-02 | 32.35 | 11.98% |
| Motorola, Inc. | MOT | 2007-01-03 | 20.46 | 2007-04-02 | 17.51 | -14.42% |
| Telefonos de Mexico, S.A. (ADR | TMX | 2007-01-03 | 28.08 | 2007-04-02 | 33.94 | 20.87% |
| ITT Corporation | ITT | 2007-01-03 | 56.39 | 2007-04-02 | 60.63 | 7.52% |
| International Paper Company | IP | 2007-01-03 | 48.12 | 2007-04-02 | 36.14 | -24.9% |
| Telstra Corporation (ADR) | TLS | 2007-01-03 | 16.23 | 2007-04-02 | 18.92 | 16.57% |
| Verizon Communications | VZ | 2007-01-03 | 36.65 | 2007-04-02 | 37.07 | 1.15% |
| Danaher Corporation | DHR | 2007-01-03 | 71.65 | 2007-04-02 | 71.47 | -0.25% |
| Pfizer Inc. | PFE | 2006-10-02 | 27.14 | 2007-04-02 | 24.77 | -8.73% |
| Walt Disney Company, The | DIS | 2006-10-02 | 30.26 | 2007-04-02 | 34.47 | 13.91% |
| Unilever N.V. (ADR) | UN | 2006-10-02 | 23.98 | 2007-04-02 | 28.58 | 19.18% |
| Xilinx, Inc. | XLNX | 2006-10-02 | 21.87 | 2007-04-02 | 25.43 | 16.28% |
| Hewlett-Packard Company | HPQ | 2006-07-03 | 32.25 | 2007-04-02 | 40.24 | 24.78% |
| Cardinal Health, Inc. | CAH | 2006-07-03 | 63.59 | 2007-04-02 | 72.98 | 14.77% |
| Phelps Dodge Corporation | PD | 2007-01-03 | 115.99 | 2007-03-19 | 129.47 | 11.62% |
| Autodesk, Inc. | ADSK | 2006-10-02 | 33.52 | 2007-01-03 | 40.56 | 21% |
| AstraZeneca PLC (ADR) | AZN | 2006-10-02 | 60.93 | 2007-01-03 | 52.22 | -14.3% |
| American Eagle Outfitters | AEO | 2006-10-02 | 29.51 | 2007-01-03 | 32.32 | 9.52% |
| Nordstrom, Inc. | JWN | 2006-10-02 | 42.52 | 2007-01-03 | 51.14 | 20.27% |
| Cadence Design Systems | CDNS | 2006-10-02 | 16.77 | 2007-01-03 | 18.15 | 8.23% |
| Lockheed Martin Corporation | LMT | 2006-10-02 | 86.0 | 2007-01-03 | 91.29 | 6.15% |
| Costco Wholesale Corp. | COST | 2006-10-02 | 48.27 | 2007-01-03 | 52.45 | 8.66% |
| Family Dollar Stores, Inc | FDO | 2006-10-02 | 28.47 | 2007-01-03 | 29.32 | 2.99% |
| Thermo Fisher Scient | TMO | 2006-10-02 | 38.98 | 2007-01-03 | 45.17 | 15.88% |
| Gap Inc., The | GPS | 2006-10-02 | 18.61 | 2007-01-03 | 19.14 | 2.85% |
| J.C. Penney Company, Inc. | JCP | 2006-10-02 | 68.41 | 2007-01-03 | 77.47 | 13.24% |
| Merck & Co., Inc. | MRK | 2006-10-02 | 40.67 | 2007-01-03 | 43.32 | 6.52% |
| Tyco International Ltd. | TYC | 2006-10-02 | 93.64 | 2007-01-03 | 102.64 | 9.61% |
| EMC Corporation | EMC | 2006-07-03 | 10.94 | 2007-01-03 | 13.2 | 20.66% |
| Time Warner Inc. | TWX | 2006-07-03 | 17.07 | 2007-01-03 | 21.92 | 28.41% |
| CNOOC Limited (ADR) | CEO | 2006-07-03 | 78.56 | 2006-10-02 | 80.6 | 2.6% |
| CBS Corporation | CBS | 2006-07-03 | 26.37 | 2006-10-02 | 27.75 | 5.23% |
| Barr Pharmaceuticals, Inc. | BRL | 2006-07-03 | 47.77 | 2006-10-02 | 52.14 | 9.15% |
| Endo Pharmaceuticals | ENDP | 2006-07-03 | 33.27 | 2006-10-02 | 33.13 | -0.42% |
| General Dynamics Corporation | GD | 2006-07-03 | 64.1 | 2006-10-02 | 72.47 | 13.06% |
| General Mills, Inc. | GIS | 2006-07-03 | 50.21 | 2006-10-02 | 54.99 | 9.52% |
| International Business Machine | IBM | 2006-07-03 | 76.66 | 2006-10-02 | 80.76 | 5.35% |
| McKesson Corporation | MCK | 2006-07-03 | 46.66 | 2006-10-02 | 53.3 | 14.23% |
| Rio Tinto plc (ADR) | RTP | 2006-07-03 | 210.28 | 2006-10-02 | 188.37 | -10.42% |
| Verizon Communications | VZ | 2006-07-03 | 30.62 | 2006-10-02 | 34.31 | 12.05% |
| Abbott Laboratories | ABT | 2006-07-03 | 42.26 | 2006-10-02 | 47.09 | 11.43% |
| Waters Corporation | WAT | 2006-07-03 | 44.48 | 2006-10-02 | 45.25 | 1.73% |

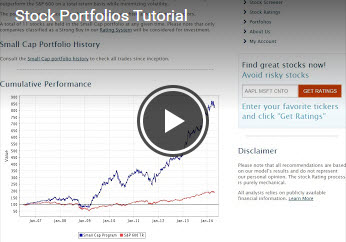
Click the following link to watch the tutorial about how to use the model stock portfolios:
Please note that all recommendations are based on our model's results and do not represent our personal opinion. The stock Rating process is purely mechanical.
All analysis relies on publicly available financial information. Learn More